How to use TFN RMT series handheld spectrum analyzer to analyze interference signals?
Dense urban base station deployment and growing demand for telecommunications services have brought various interference problems to mobile operators. Due to the sharp increase in spectrum resources and the frequent occurrence of interference events, mobile service providers are constantly researching new ways to improve network and signal quality. In order to solve problems in backbone point-to-point wireless networks and improve the quality of existing networks, the RMT series handheld spectrum analyzer launched by TFN can solve problems including interference location & analysis.

First, let's take a look at the steps to confirm and locate interference
Use a spectrum analyzer to confirm the presence of wireless interference
Confirm the type of interference by knowing other wireless signals in the environment
Connect a directional antenna to the spectrum analyzer to determine the location of the interference
Correct or remove the interference source
TFN RMT series handheld spectrum analyzers have powerful interference analysis functions. Seven measurement modes (persistence, signal strength, waterfall chart, outdoor map, RSSI, indoor map and time gate) can quickly and intuitively test the amplitude, frequency, state and location of interference signals. Here we introduce the seven interference measurement modes:
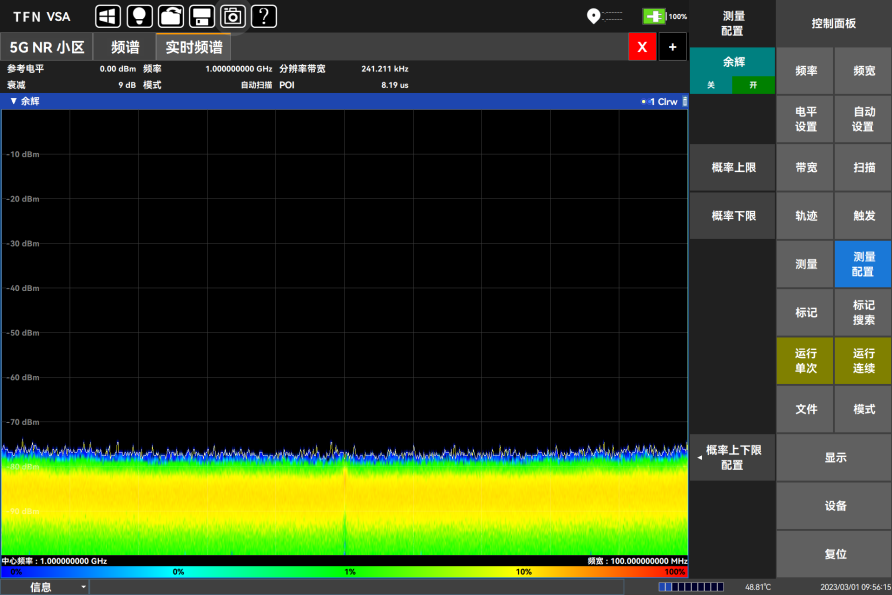
Persistence Chart Measurement
The persistence chart represents the probability of a certain spectrum appearing within a fixed time. In the spectrum display area, the horizontal axis represents frequency, the vertical axis represents amplitude, and the color represents the probability of signal occurrence. Red represents a 100% probability of spectrum occurrence, blue represents a probability of 0, and the color gradient from red to blue decreases according to the probability level shown in the diagram. In the spectrum display area, the cursor function mark can be used to view the three-dimensional information of any position in the image. Through the persistence diagram in the real-time spectrum analysis mode, the density of each frequency and amplitude corresponding position can be demonstrated with different color levels. The color expresses the probability of signal occurrence. We can easily view the weak signal hidden under the strong signal from the persistence diagram through the color difference, which can more intuitively and specifically display the signal change trend and frequency.
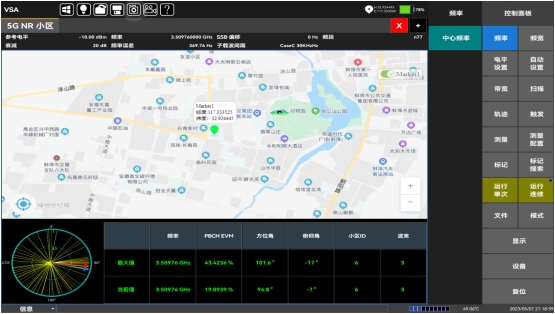
Signal Strength Measurement
TFN RMT series handheld spectrum analyzer with handheld direction finding antenna can measure the signal strength in different directions.
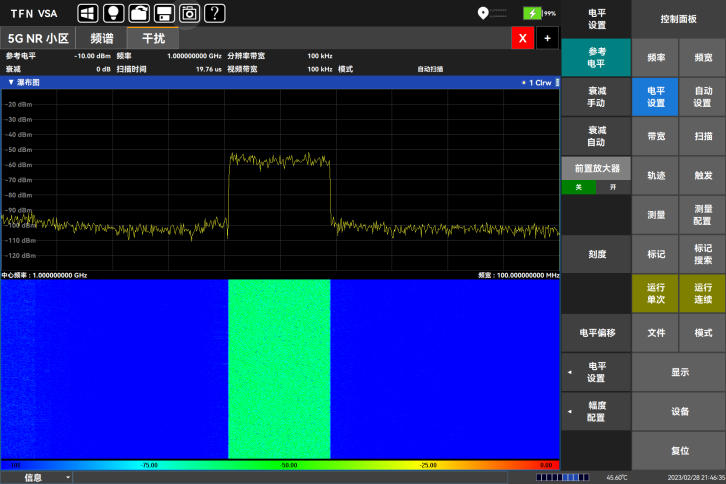
Waterfall Chart Measurement
The waterfall chart uses the frequency-amplitude-time three-dimensional display method to intuitively observe periodic or intermittent signals. In the waterfall chart, different colors reflect the strength of the signal amplitude.
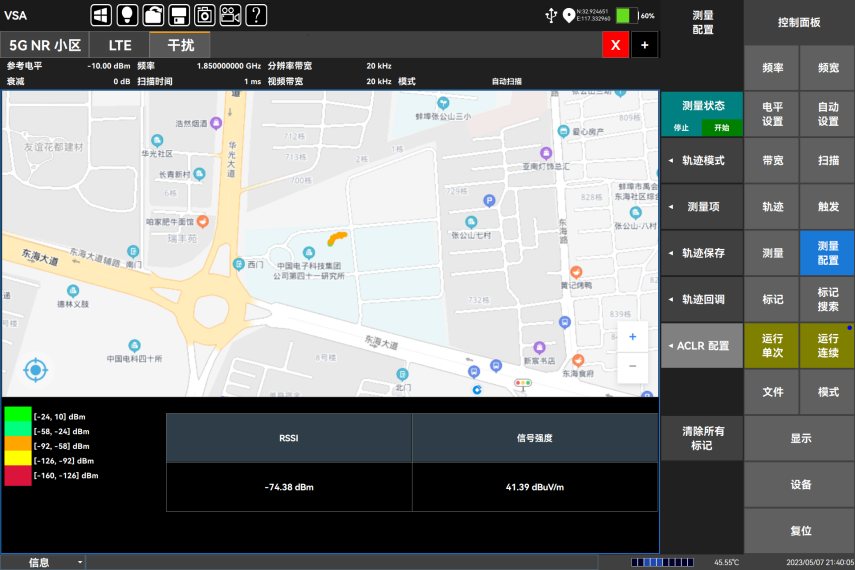
Outdoor Map Measurement
Outdoor map can perform RSSI test and ACLR test, and the test results can be marked on the map in real time according to time or distance to form trajectory information.
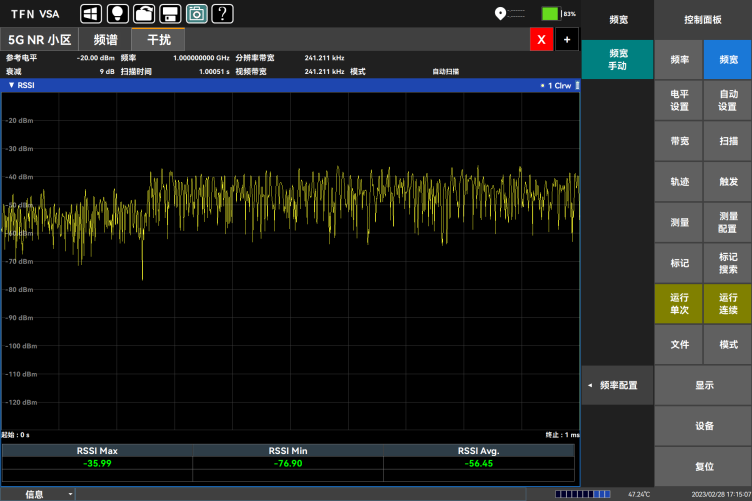
RSSI Measurement
RSSI is mainly used to measure the strength change of a point frequency signal over a period of time.
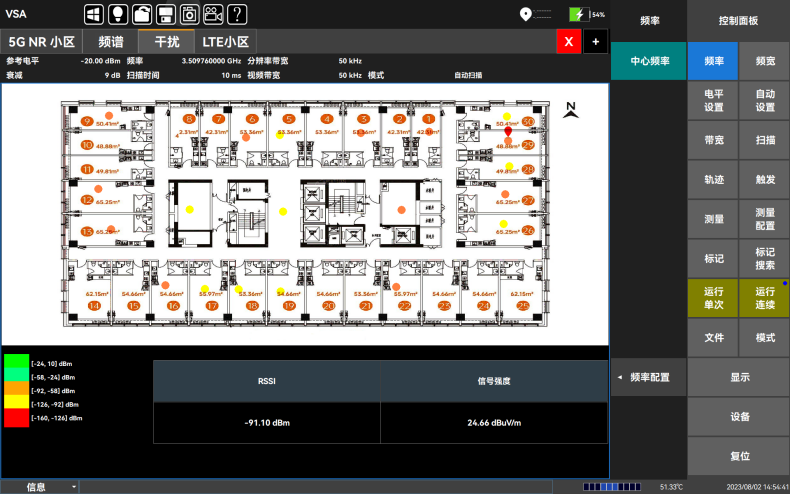
Indoor Map Measurement
The indoor map option can perform RSSI test and ACLR test. Since GPS signal cannot be received indoors, users need to manually move the location and mark the test results on the map. The test results marked on the map can be saved to the instrument for later viewing.
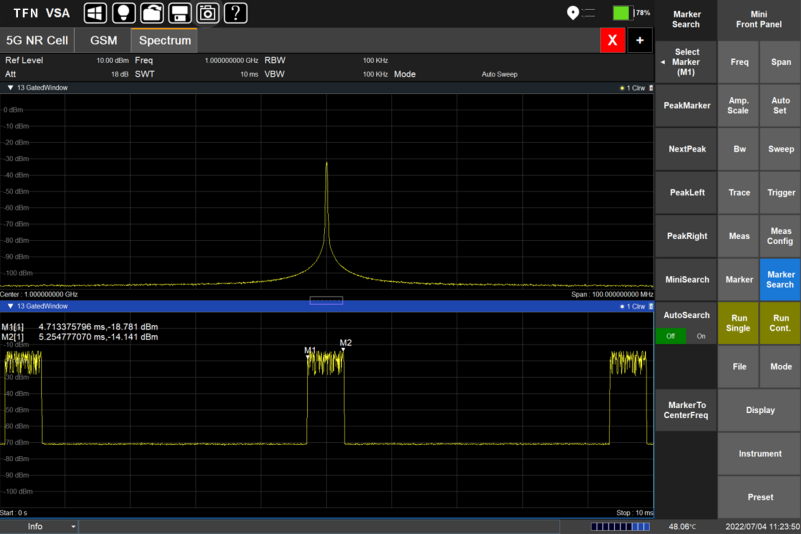
Time Gate Measurement
Gatetime can be applied to relatively complex signals and can separate mixed spectrum signals. By correctly setting the time gate, you can specify the signal you want to measure and exclude or shield other interfering signals. It is practical to measure signals that are difficult to analyze.
The performance of wireless transmission systems is usually affected by various interference sources, and a handheld spectrum analyzer equipped with a directional antenna is the most convenient and effective measurement device for identifying and locating interference sources.
The TFN RMT series handheld spectrum analyzer has multiple measurement modes in the field of interference analysis, which greatly facilitates engineers to locate and analyze interference sources, accurately and efficiently correct or remove interference sources, and restore the communication system to the best operating level.
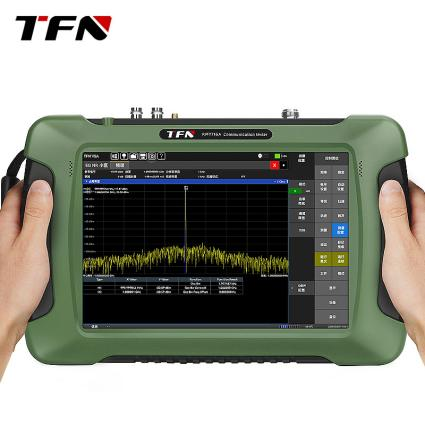
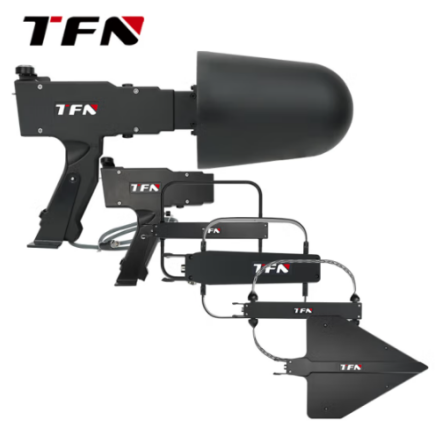
The TFN RMT series handheld spectrum analyzer has multiple frequency band models for you to choose from. The interference location & analysis function is a standard option in all models, and there are also optional directional antennas of different frequency bands for you to choose from:
RMT714A (Frequency range: 5KHz-4.5GHz)
RMT716A (Frequency range: 5KHz-6.32GHz)
RMT717A (Frequency range: 5KHz-7.5GHz)
RMT719A (Frequency range: 5KHz-9GHz)
RMT720A (Frequency range: 5KHz-20GHz)
RMT740A (Frequency range: 5KHz-40GHz)
Directional antenna set (with handle) TF908 (Frequency range: 9KHz-8GHz)
Directional antenna set (with handle) TM9265 (Frequency range: 9KHz-26.5GHz)
If you are interested in TFN If you are interested in the RMT series handheld spectrum analyzer, please contact TFN sales team:
Email: info@tfngj.com
WhatsApp: +86-18765219251
Facebook: https://www.facebook.com/tfnfate/
